Moving Beyond Last-Click Attribution
Last-click attribution—crediting the final touchpoint before conversion with 100% of the value—is the most common attribution model and the most misleading. It systematically undervalues channels that appear early in the customer journey and overvalues channels that appear late.
Consider a typical B2B customer journey: A LinkedIn ad catches attention. The prospect visits the website but doesn’t convert. A week later, they search for a relevant term and find a blog post. They read it and subscribe to the newsletter. Two weeks later, they receive an email with a case study. They click, read, and still don’t convert. Finally, they search for the brand name directly and request a demo. Last-click attribution gives 100% credit to branded search for the demo request. The LinkedIn ad, blog post, and email receive zero credit despite playing essential roles in the journey.
Multi-touch attribution solves this problem by distributing credit across multiple touchpoints. Linear attribution gives equal credit to each touchpoint. Time-decay attribution gives more credit to touchpoints closer to conversion. Position-based attribution gives 40% to first touch, 40% to last touch, and 20% to everything in between. Data-driven attribution uses machine learning to determine actual influence patterns.
Implementing multi-touch attribution requires significant infrastructure. Google Analytics 4 supports several models but requires consistent event tracking across channels. Marketing automation platforms like HubSpot and Marketo provide attribution reporting. Dedicated attribution tools like Rockerbox or Triple Whale offer advanced capabilities for sophisticated marketers.
The investment in proper attribution pays for itself through better budget allocation. Businesses using multi-touch attribution consistently reallocate budget from last-click-overvalued channels to last-click-undervalued channels, improving overall marketing ROI by 15-30%.
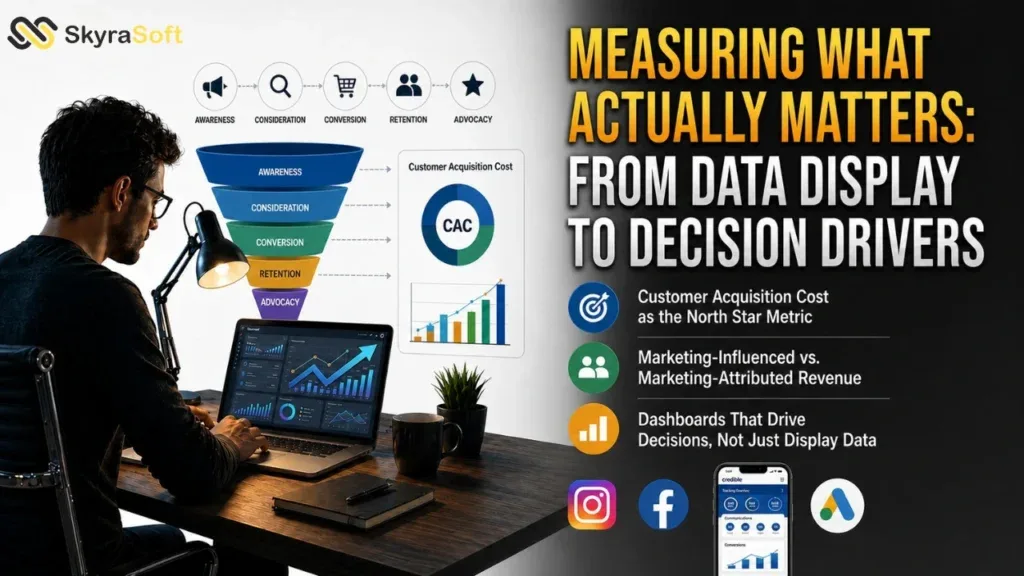
Customer Acquisition Cost as the North Star Metric
Customer acquisition cost—total marketing and sales spend divided by number of new customers acquired—is the single most important metric for evaluating marketing efficiency. CAC tells you whether your marketing is generating value or destroying it.
Calculating CAC correctly requires including all relevant costs. Direct ad spend is obvious. But creative production, agency fees, software subscriptions, salaries for marketing and sales staff, and overhead allocations all belong in the calculation. Many businesses understate CAC by excluding these costs, leading to overoptimistic conclusions about channel performance.
CAC varies dramatically by channel. For many businesses, organic search has the lowest CAC because content continues to attract customers without ongoing spend. Referral programs often have low CAC because existing customers do the marketing. Paid channels typically have higher CAC but offer predictable scaling.
CAC must be evaluated in relation to customer lifetime value. A high CAC is sustainable if LTV is even higher. A low CAC is meaningless if customers churn immediately. The LTV:CAC ratio—typically targeting 3:1 or higher—provides the complete picture of marketing economics.
Reducing CAC is a continuous process. Improving conversion rates reduces CAC because more customers come from the same traffic. Increasing retention reduces effective CAC because acquisition costs are amortized over longer customer relationships. Optimizing channel mix toward lower-CAC channels reduces overall CAC. Each percentage point improvement in CAC compounds across the entire customer base.
Lifetime Value—The Metric That Changes Everything
Customer lifetime value represents the total revenue a business can expect from a single customer over the entire relationship. LTV transforms marketing from a cost center into a profit driver by revealing how much you can afford to spend acquiring customers.
Calculating LTV requires three inputs: average purchase value, average purchase frequency, and average customer lifespan. Multiply these together: LTV = Average Purchase Value × Purchase Frequency × Lifespan. For subscription businesses, LTV = Average Monthly Revenue × Gross Margin ÷ Monthly Churn Rate.
LTV varies significantly by acquisition channel. Customers acquired through organic search typically have higher LTV than those acquired through paid channels because they arrived with trust already established. Customers acquired through referrals have the highest LTV because the referral implies social proof. Customers acquired through deep discounts often have lower LTV because they are price-sensitive and less loyal.
Improving LTV is often more profitable than reducing CAC. Increasing retention by 5% can increase profits by 25-95% because retained customers buy more, cost less to serve, and refer new customers. Upselling and cross-selling increase average purchase value without additional acquisition cost. Loyalty programs and exceptional customer service extend lifespan.
Segmenting LTV by customer type reveals which segments deserve the most marketing investment. The 80/20 rule applies: 20% of customers often generate 80% of LTV. Identifying and targeting similar customers—lookalike audiences—improves marketing efficiency dramatically.
Marketing-Influenced vs. Marketing-Attributed Revenue
The distinction between marketing-attributed revenue (directly credited to marketing touchpoints) and marketing-influenced revenue (touched by marketing at any point in the customer journey) is critical for accurate performance assessment.
Marketing-attributed revenue is conservative. It includes only conversions where a marketing touchpoint received attribution credit. Depending on the attribution model, this might undercount marketing’s true contribution.
Marketing-influenced revenue is expansive. It includes all revenue from customers who had any interaction with marketing—even if the final conversion came from direct traffic or a sales call. This metric captures marketing’s role in creating aware, educated prospects who eventually convert through other channels.
Most businesses should track both. Marketing-attributed revenue guides channel optimization. Marketing-influenced revenue guides budget allocation. The gap between them indicates marketing’s role in creating demand versus capturing demand.
In B2B businesses with sales teams, marketing-influenced revenue is particularly important. Marketing might generate awareness, educate prospects, and capture leads, but the final conversion happens on a sales call. Last-click attribution would give the sales call all credit. Marketing-influenced attribution correctly recognizes marketing’s essential role in the journey.
Aligning marketing and sales on shared metrics—pipeline revenue, opportunity creation, win rates—ends the endless debate about whether marketing is working. When both teams measure the same outcomes, they collaborate rather than compete.
Dashboards That Drive Decisions, Not Just Display Data
The final challenge in measuring what matters is presentation. A dashboard filled with numbers and charts is not valuable if it does not drive decisions. Effective dashboards focus on actionable metrics, provide context through trends and targets, and enable drill-down from summary to detail.
The most valuable dashboards answer specific questions rather than displaying all available data. “Which channels are delivering the lowest CAC?” “Which customer segments have the highest LTV?” “How is marketing-influenced revenue trending relative to target?” Each question leads to a specific decision: reallocate budget, adjust targeting, increase or decrease spend.
Trends matter more than absolute values. A 5% conversion rate might be excellent or terrible depending on industry benchmarks and historical performance. Showing conversion rate over time, with targets and confidence intervals, provides the context needed for judgment.
Drill-down capability transforms dashboards from static reports into analytical tools. A dashboard showing declining overall conversion should allow clicking through to conversion by channel, then by campaign, then by ad creative. This drill-down path enables root cause identification rather than just problem awareness.
Automated alerting ensures that problems receive attention before they become crises. A dashboard that requires someone to look at it regularly will be ignored. Automated alerts triggered by performance thresholds—CAC exceeding target, conversion dropping below baseline—bring exceptions to attention immediately.
The ultimate test of any metric or dashboard is whether it changes behavior. Metrics that never lead to decisions should be removed. Dashboards that nobody acts on should be redesigned. Measuring what actually matters is not an academic exercise. It is the foundation of marketing that drives enterprise value.